
written by
Tanya Aulachynskaya
Having a growth team within a company obviously seems important — it helps boost customer acquisition, retention, and, eventually, revenue. However, not all companies manage to build a growth team that brings valuable results. Here’s a look at why growth is much more than “Let’s make this button green”, and why product analytics are so critical.
In summer 2019, PandaDoc CTO Sergey Barysiuk decided to organize a Growth track within PandaDoc’s Product team — essentially, a separate team focused on experimentation and growth initiatives. At that time, I was a product manager for the core product, while also driving a lot of “growth” work, such as experimental and product funnel improvements within the regular product backlog.
Sergey’s idea seemed like a good call: Dedicated focus and people would allow us to experiment faster. Our first ideas were generated by a small team of two developers (whom we hired), myself as a product manager, and a tech lead / data analyst. Within a few months, we made more than ten minor improvements to the product. However, it was hard to understand their impact, as these improvements were mainly local.
By the end of that year, PandaDoc’s Product and Engineering teams were in the midst of major restructuring, so we moved to the common backlog and cross-functional teams. Although our growth initiatives gained priority, we faced some uncertainties and lost the speed of experimentation with a dedicated team. Then, when COVID hit in March 2020, we spearheaded a true “growth” project when 20-plus of us launched our Free eSign product within just 24 hours — truly a cross-functional triumph.
However, the “common backlog” mode wasn’t resulting in much focus on other growth projects for six-plus months. Also, our Free eSign product needed attention — while it attracted a lot of users, we struggled to efficiently convert these users over to paid plans and, in the meantime, build a decent experimentation pipeline.
.png)
In August 2020, we formed our Growth track as a separate unit. It consisted of two dedicated development teams, one designer, two product managers (myself and a teammate), and one engineering manager. One challenge we faced was that the development teams weren’t keen to work on these projects because they considered the work unchallenging — we had to reassure them that the work would be more than simply recoloring interface buttons. After working with the engineering teams for one quarter, we got more positive feedback on our work and its impact on the overall product. Things accelerated as teams built a rapport with product managers and became increasingly engaged in shifting metrics.
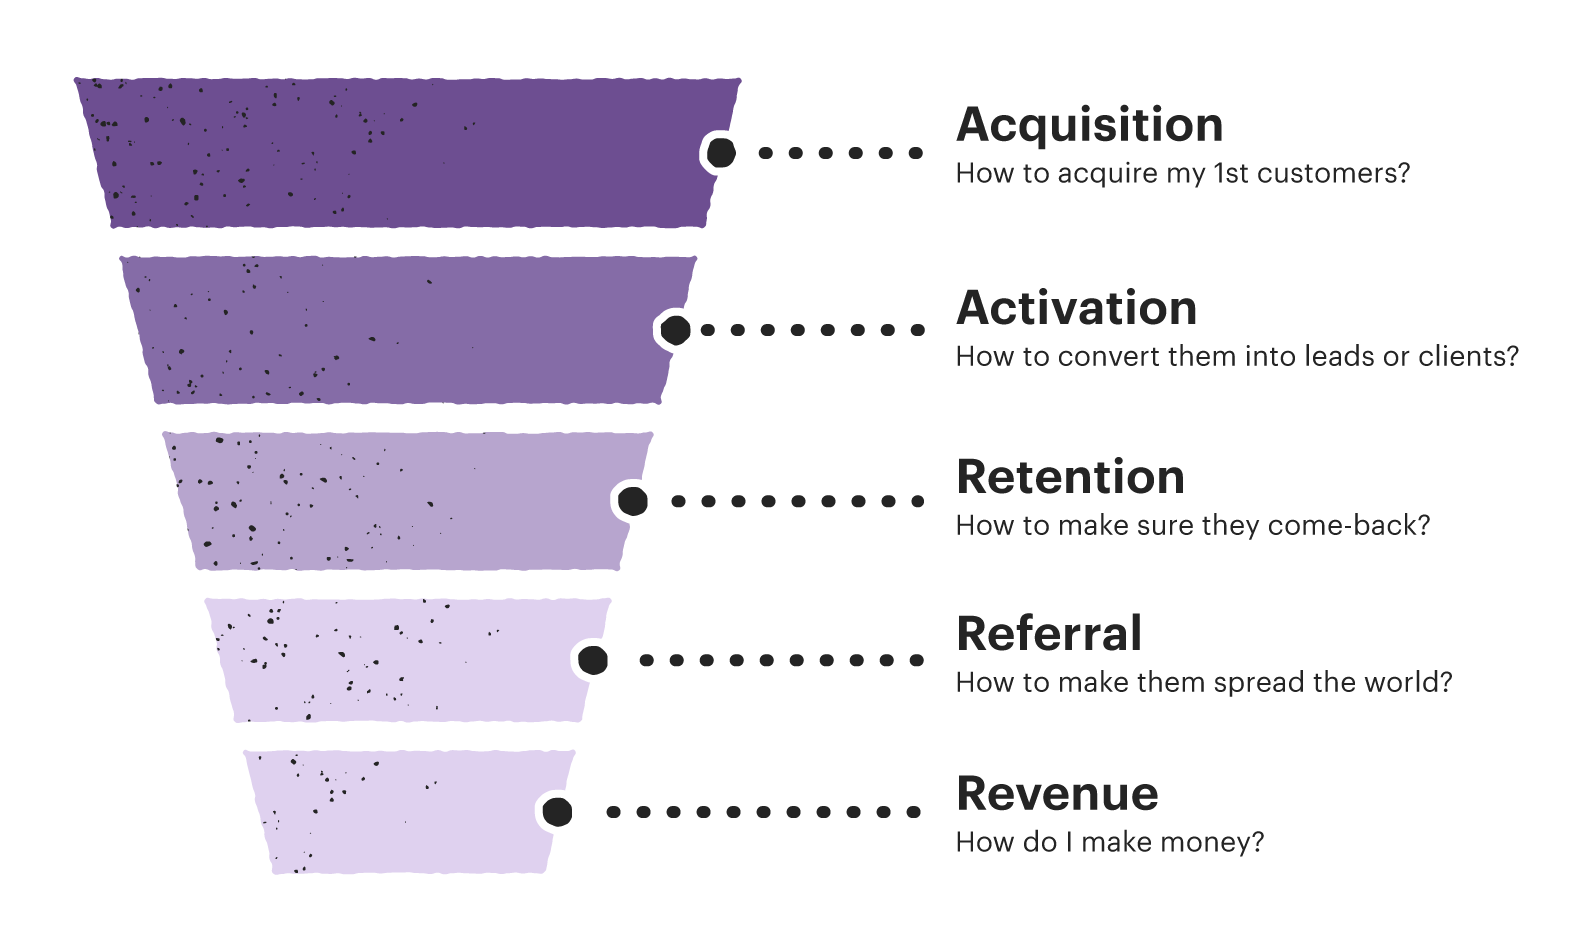
We also changed our approach to experiments. Instead of picking random improvements from an extensive list, we focused on funnel metrics and divided our work into four significant areas, inspired by the old-but-gold “Metrics for Pirates” framework by Dave McClure:
For each of these areas, we came up with quarterly strategies that would complement one another and serve as a north star. By consistently pushing one specific metric, we were able to show results at the company level, and a particularly good example is how we increased our conversion rate from Free eSign to paid customers tenfold. We’ve been working this way ever since.
A/B testing within our Growth team constitutes about only 20 percent of our improvements list. A lack of traffic in the middle of the funnel is one of the reasons we don’t focus on it much. For example, an experiment on our activation rate takes about two weeks to reach a sample size required for statistical significance, which means we can do merely two A/B tests per month in activation. This is even more challenging within monetization: When users start converting, we have even lower portions of those who see the paywalls we want to optimize. A/B tests often lead to local optimizations, and sometimes it makes more sense to remake significant areas of the product.
Along the way, we also have to build a foundation for experiments. It’s not about the A/B testing architecture, but rather the product capabilities that push the metrics further. For example, to grow our number of invitations sent to team members of organizations using PandaDoc, we first need to adopt features that allow these team members to collaborate through sharing documents, granting permissions, and commenting. When this adoption rate goes up, users are more likely to invite their colleagues — simply adding “Invite” buttons won’t work. Indeed, Growth work is much deeper than just recoloring buttons (I’ve heard this a lot!).

Choosing what to work on and generating ideas to push metrics are the most common questions. How can you understand whether or not you can drive a specific metric? I recommend measuring the product around these core funnel metrics and comparing them to benchmarks. Surprisingly, many products are very similar in their operations if they share a similar business model.
In our case, we mainly sell subscriptions to our service: One license per user within an organization registered to use PandaDoc. So, our value metric is the number of users actively using our application. Recognizing industry benchmarks, you can see where a product needs more attention. Here’s the set of actual criteria for SaaS created by OpenView, a well-known venture fund.
Let’s imagine you have many signups, but your conversion rate from signup-to-paid is low compared to other products. How do you grow this metric? Consider monitoring an activation rate, such as how many people complete a meaningful action after registering. If this figure is low, it makes sense to work on improving activation and adoption of the product’s core use case. If activation exceeds 20-40 percent, but people still don’t convert, you may want to focus on the next stage of the funnel. How do you monetize these users? Are they satisfied with the free offering and unwilling to use paid features?
There are gold standards for B2B SaaS businesses when it comes to expansion rate and churn: Churn in monthly recurring revenue should not be higher than 2 percent, while net dollar retention — expansion plus reactivation, minus contraction and churn — should approach or exceed 100 percent. If you can operate within these benchmarks, you’ll have a better chance of growing faster and increasing revenue.
The world of product analytics is fascinating. The more you study metrics, the more exciting things you uncover. This is especially true if you have a complex product and a high number of users. Of course, a metric can sometimes take an unexpected turn for the worse — for example, if we see a drop in an activation or conversion rate — and when it does, it needs careful consideration. Sometimes we discover a bug, or that our product is being used extensively by spammers. For example, when we started working on GDPR compliance and collecting customer consent for marketing and sales communication, this led to a drop in conversion rates.
Due to the current recession, many companies see their expansion rate decreasing and churn increasing. Companies that use software keep reducing costs and saving money on tools. Growth is slowing and investors are behaving conservatively, not providing as much support as they did just a few years ago.
However, we’re always finding ways to ensure our product doesn’t lose revenue, while also helping our customers overcome the recession — and one such way is retaining customers with discounts. This approach helps us reduce costs on spending that isn’t bringing revenue back, while reminding us to take even greater care of product quality.
Over the years, we’ve grown our Engineering team consistently. Currently, 35 engineers work in small teams consisting of two front-end engineers, one back-end engineer, and a QA engineer. Additionally, we have four engineering managers, five designers, two product analysts, and eight product managers. Product managers and designers specialize in a specific funnel area, but development teams don’t.
Along the way, it’s important that everyone on the team shares the same set of business values:
1. No data — no trust. All engineers should understand the basics of product analytics, such as how to implement analytical events and user properties, how to check everything is working properly, and how to set up an A/B test and understand its goals.
2. Better done than perfect. In many cases, a bit of improvement within one sprint lets us reach the metric growth that could bring a return on an investment. However, this may not be the case if we take up to three or four sprints, so sometimes it’s better to make a tiny improvement, analyze it, and continue onward if the improvement demonstrates any traction. A perfect engineering solution might not be used by anyone, nor may it get clicks within the interface or help us grow in the long-term. In our case, most improvements take one or two sprints’ worth of work. Each quarter, we’ll take on two or three so-called big rocks — improvements that require more than three sprints — but we’ll break them down as much as possible to drive early value.
3. It's OK if 70 percent of hypotheses fail. Engineers must also be prepared to pursue additional iterations on failed tests and remove tests that don’t work. (We often reiterate on something if we discover unusual user behavior or if the a/b test has lost.) Tolerance for setbacks and readiness to move on with new ideas is crucial.


.png)
Acquisition is the art of attracting new customers, and it's one of the most essential stages of the product funnel. This article will share how PandaDoc, an all-in-one document management solution, learned to acquire new customers using document templates.
.png)
The onboarding period is critical, as you should show your solution at its best. Otherwise, new users will miss the value of your solution. At PandaDoc, we’ve come a long way and tried different approaches to our onboarding. In this article, we’re going to show you what we’ve learned through this process.

The actual life of your product begins when customers start paying for it. It may sound like Captain Obvious, but every product’s monetization strategy consists of what your customers are paying for, and how much they’re paying for it — even if it isn’t being tracked. If you invest in feature development but don’t update your monetization strategy, it’s time to think of all the opportunities you’re missing.Here’s a detailed look at several crucial learnings about monetization that we’ve gathered through research and experimentation at PandaDoc.